{
"cells": [
{
"cell_type": "markdown",
"id": "d3bc52a7-6c7d-49b5-b6d4-b43a74e0ef34",
"metadata": {},
"source": [
"Peter Norvig
April 2024
\n",
"\n",
"# Counting Cluster Sizes\n",
"\n",
"Zach Wissner-Gross's *Fiddler on the Proof!* column [poses a question](https://thefiddler.substack.com/p/can-you-paint-by-number) that I will restate as:\n",
"\n",
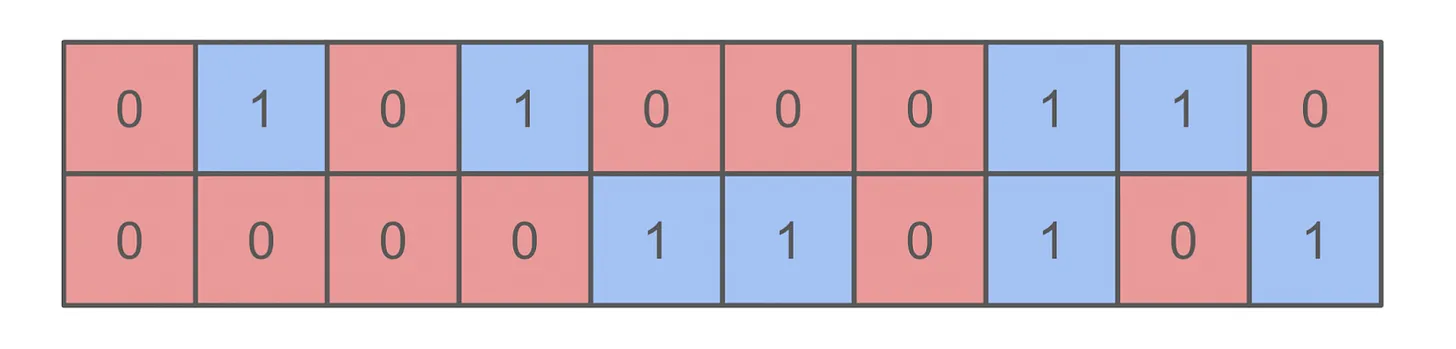
"Consider a two-dimensional grid of squares, where each square is colored either red or blue. A **cluster** is a group of contiguous squares of the same color (contiguity must be horizontal or vertical, not diagonal). For example, in the following 10 × 2 grid there are four red clusters and five blue clusters:\n",
"\n",
"\n",
"\n",
"Altogether there are 20 squares and 9 clusters, so the average cluster size is 20/9 ≈ 2.22 squares. Under the assumption that every square is equally likely to be red or blue, Zach poses two questions (and I'll add three more):\n",
"\n",
"- What is the average cluster size for a grid consisting of a single infinitely long row?\n",
"- What is the average cluster size for a grid consisting of two infinitely long rows?\n",
"- What is the average cluster size for a grid of any given size *w* × *h*?\n",
"- What if there are three or more colors rather than just two?\n",
"- If you pick a random square, what is the average size of its cluster?\n",
"\n",
"# Code to Make Grids and to Count Clusters\n",
"\n",
"I can see three approaches to answering these questions:\n",
"1) Enumerate all possible grids up to a certain size, compute the average cluster size for each grid, and average the averages. This gives an exact answer for grids of a specific size, but it can't say anything about infinite size grids. In fact it starts getting slow for grids with more than about 20 squares, because there are 2*n* grids with *n* squares. \n",
"2) Randomly select some grids and average cluster sizes over them. This can handle grids with thousands of squares, but the averages will be only estimates.\n",
"3) Come up with a mathematical proof that proves the answer for grids of any width *w*.\n",
"\n",
"\n",
"I can easily write code to implement the first two approaches. I'll start with some imports and the definition of three data types:"
]
},
{
"cell_type": "code",
"execution_count": 1,
"id": "4ddf868c-8902-49f3-8bdd-79d9377d1a11",
"metadata": {},
"outputs": [],
"source": [
"import itertools \n",
"import random\n",
"from statistics import mean, stdev\n",
"from typing import *\n",
"\n",
"Square = Tuple[int, int] # A square is a pair of `(x, y)` coordinates, e.g. `(2, 1)`.\n",
"Grid = Dict # A dict of `{square: contents}`e.g. {(1, 1): 1, (2, 1): 'B'}\n",
"Color = str # A color is represented by a one-character string, e.g. 'R' for red and 'B' for blue\n",
"COLORS = ('R', 'B')\n"
]
},
{
"cell_type": "markdown",
"id": "9a0980a5-2a66-4533-b16c-ad3ab810251a",
"metadata": {},
"source": [
"Now I'll define the function `all_grids` to make a list of all possible grids of a given size (all possible ways to color each square), and `random_grids` to sample `N` different grids of a given size. The helper function `one_grid` makes a single grid from a sequence of colors."
]
},
{
"cell_type": "code",
"execution_count": 2,
"id": "3fa0280d-3e62-4645-8096-a9156b170ca1",
"metadata": {},
"outputs": [],
"source": [
"def all_grids(width: int, height: int, colors=COLORS) -> List[Grid]:\n",
" \"\"\"All possible grids with given width, height, and color set.\"\"\"\n",
" return [one_grid(width, height, colorseq) \n",
" for colorseq in itertools.product(colors, repeat=(width * height))]\n",
"\n",
"def random_grids(width: int, height: int, N: int, colors=COLORS) -> List[Grid]:\n",
" \"\"\"N grids of size width × height, filled with random colors.\"\"\"\n",
" return [random_grid(width, height, colors) for _ in range(N)]\n",
"\n",
"def random_grid(width: int, height: int, colors=COLORS) -> Grid:\n",
" \"\"\"A single random grid.\"\"\"\n",
" return one_grid(width, height, [random.choice(colors) for _ in range(width * height)])\n",
"\n",
"def one_grid(width: int, height: int, colorseq: Sequence[Color]) -> Grid: \n",
" \"\"\"A grid of given size made from the sequence of colors.\"\"\"\n",
" squares = [(x, y) for y in range(height) for x in range(width)]\n",
" return dict(zip(squares, colorseq))"
]
},
{
"cell_type": "markdown",
"id": "fcd29cb3-c7cf-4036-8659-6cd87c116c16",
"metadata": {},
"source": [
"Finally, the function `cluster` mutates the grid so that each square's contents is changed from a color to a cluster number, where 1 is the number of the first cluster, 2 of the next cluster, and so on. It uses a [flood fill](https://en.wikipedia.org/wiki/Flood_fill) algorithm."
]
},
{
"cell_type": "code",
"execution_count": 3,
"id": "998ba6a6-8355-4474-9f78-92918f18656a",
"metadata": {},
"outputs": [],
"source": [
"def cluster(grid: Grid[Square, Color]) -> Grid[Square, int]:\n",
" \"\"\"Mutate grid, replacing colors with cluster numbers.\n",
" Do a flood fill, replacing one cluster of adjacent colors with an integer cluster number,\n",
" then incrementing the cluster number and continuing on to find the next cluster.\"\"\"\n",
" cluster_number = 0 \n",
" for square in grid:\n",
" c = grid[square]\n",
" if isinstance(c, Color):\n",
" cluster_number += 1\n",
" # Assign `cluster_number` to `square` and all its neighbors of the same color\n",
" Q = [square] # queue of squares in cluster `cluster_number`\n",
" while Q: \n",
" sq = Q.pop()\n",
" if sq in grid and grid[sq] == c: \n",
" grid[sq] = cluster_number\n",
" Q.extend(neighbors(sq))\n",
" return grid\n",
"\n",
"def mean_cluster_size(grids: Collection[Grid]) -> float: \n",
" \"\"\"Mean size of the clusters in a collection of grids.\"\"\"\n",
" return mean(len(grid) / max(cluster(grid).values()) for grid in grids)\n",
" \n",
"def neighbors(square: Square) -> List[Square]:\n",
" \"\"\"The four neighbors of a square.\"\"\"\n",
" (x, y) = square\n",
" return [(x + 1, y), (x - 1, y), (x, y + 1), (x, y - 1)]"
]
},
{
"cell_type": "markdown",
"id": "1bcebc7b-d59e-4bea-b735-c372fd91cfb1",
"metadata": {},
"source": [
"# Answering the Questions\n",
"\n",
"Here's a function to help answer the questions:"
]
},
{
"cell_type": "code",
"execution_count": 4,
"id": "816f854a-7c99-4022-b539-98f87bc20369",
"metadata": {},
"outputs": [],
"source": [
"def do(W, h, N=30_000, colors='RB') -> None: \n",
" \"\"\"For each width w from 1 to W, print the mean cluster size of w x h grids.\n",
" If `N` is an integer, randomly sample `N` grids.\n",
" If `N` is `all`, exhaustively enumerate all possible grids.\"\"\"\n",
" which = \"all possible\" if N is all else f\"{N:,d} randomly sampled\"\n",
" print(f' Average cluster size over {which} grids of width 1–{W} and height {h}:')\n",
" for w in range(1, W + 1):\n",
" grids = all_grids(w, h, colors) if N is all else random_grids(w, h, N, colors)\n",
" print(f'{w:2} × {h} grids: {mean_cluster_size(grids):6.4f}')"
]
},
{
"cell_type": "markdown",
"id": "0c5a9d5a-58b2-4cf9-b2ff-33078461bb97",
"metadata": {},
"source": [
"# One-Row Grids\n",
"\n",
"Let's see what we get. First an exact calculation over all possible grids up to size 14 × 1:"
]
},
{
"cell_type": "code",
"execution_count": 5,
"id": "e004289f-0c81-46ab-8900-9312a0aa6f7c",
"metadata": {},
"outputs": [
{
"name": "stdout",
"output_type": "stream",
"text": [
" Average cluster size over all possible grids of width 1–14 and height 1:\n",
" 1 × 1 grids: 1.0000\n",
" 2 × 1 grids: 1.5000\n",
" 3 × 1 grids: 1.7500\n",
" 4 × 1 grids: 1.8750\n",
" 5 × 1 grids: 1.9375\n",
" 6 × 1 grids: 1.9688\n",
" 7 × 1 grids: 1.9844\n",
" 8 × 1 grids: 1.9922\n",
" 9 × 1 grids: 1.9961\n",
"10 × 1 grids: 1.9980\n",
"11 × 1 grids: 1.9990\n",
"12 × 1 grids: 1.9995\n",
"13 × 1 grids: 1.9998\n",
"14 × 1 grids: 1.9999\n"
]
}
],
"source": [
"do(14, 1, all)"
]
},
{
"cell_type": "markdown",
"id": "dda7a929-b903-47e2-891a-d4544dfb86ec",
"metadata": {},
"source": [
"Let's compare that to the random sampling approach, which can handle wider grids:"
]
},
{
"cell_type": "code",
"execution_count": 6,
"id": "306d2161-07aa-4b8e-9c54-8462e0a0d6ac",
"metadata": {},
"outputs": [
{
"name": "stdout",
"output_type": "stream",
"text": [
" Average cluster size over 30,000 randomly sampled grids of width 1–20 and height 1:\n",
" 1 × 1 grids: 1.0000\n",
" 2 × 1 grids: 1.5025\n",
" 3 × 1 grids: 1.7502\n",
" 4 × 1 grids: 1.8762\n",
" 5 × 1 grids: 1.9374\n",
" 6 × 1 grids: 1.9726\n",
" 7 × 1 grids: 1.9912\n",
" 8 × 1 grids: 1.9987\n",
" 9 × 1 grids: 1.9960\n",
"10 × 1 grids: 2.0011\n",
"11 × 1 grids: 1.9928\n",
"12 × 1 grids: 1.9976\n",
"13 × 1 grids: 2.0020\n",
"14 × 1 grids: 1.9991\n",
"15 × 1 grids: 2.0034\n",
"16 × 1 grids: 1.9952\n",
"17 × 1 grids: 1.9995\n",
"18 × 1 grids: 1.9984\n",
"19 × 1 grids: 1.9925\n",
"20 × 1 grids: 2.0022\n"
]
}
],
"source": [
"do(20, 1, 30_000)"
]
},
{
"cell_type": "markdown",
"id": "138d8441-b233-457f-97d6-81946e8a07fa",
"metadata": {},
"source": [
"The answer seems to be converging on 2. The random sampling approach has pretty good agreement with the exhaustive approach, always agreeing to within 0.01, and sometimes to within 0.001.\n",
"\n",
"Now that I see these results, I can describe a mathematical justification of why the limit is 2. In fact, I have two justifications:\n",
"\n",
"**First**: what is the average number of new clusters introduced per column? Half the time column *k* will be different from the previous column *k* - 1, and thus half the time a column will introduce a new cluster. So with *W* columns there will be *W*/2 clusters, and the average cluster size will be *W*/(*W*/2) = 2.\n",
"\n",
"**Second**: what is the average length of a cluster that starts in a given column? Every cluster starts with one first square. Half the time, the next square will be the same color, giving two in a row. Continuing, we would get three in a row a quarter of the time, four in a row an eigth of the time, and so on. So using the [formula for the sum of a geometric series](https://en.wikipedia.org/wiki/Geometric_series) we get:\n",
"\n",
"mean cluster size = Σi∈{0,1,...∞} (1/2)n = 1 / (1 - (1/2)) = 2\n",
"\n",
"# Two-Row Grids\n",
"\n",
"Now consider grids that are two rows tall, using both approaches:"
]
},
{
"cell_type": "code",
"execution_count": 7,
"id": "e2f0c3ca-acac-4dd8-9970-c846e3389ad5",
"metadata": {},
"outputs": [
{
"name": "stdout",
"output_type": "stream",
"text": [
" Average cluster size over all possible grids of width 1–9 and height 2:\n",
" 1 × 2 grids: 1.5000\n",
" 2 × 2 grids: 2.1250\n",
" 3 × 2 grids: 2.4688\n",
" 4 × 2 grids: 2.6682\n",
" 5 × 2 grids: 2.7920\n",
" 6 × 2 grids: 2.8737\n",
" 7 × 2 grids: 2.9305\n",
" 8 × 2 grids: 2.9717\n",
" 9 × 2 grids: 3.0027\n"
]
}
],
"source": [
"do(9, 2, all)"
]
},
{
"cell_type": "markdown",
"id": "de68a7e0-ced6-4c23-a806-3abacfc0927c",
"metadata": {},
"source": [
"With widths up to 9, the mean is getting close to 3, but I don't think it is converging to exactly 3. "
]
},
{
"cell_type": "code",
"execution_count": 8,
"id": "c7b56724-5bb7-4395-87b5-0268abb30ff1",
"metadata": {},
"outputs": [
{
"name": "stdout",
"output_type": "stream",
"text": [
" Average cluster size over 30,000 randomly sampled grids of width 1–25 and height 2:\n",
" 1 × 2 grids: 1.5005\n",
" 2 × 2 grids: 2.1190\n",
" 3 × 2 grids: 2.4684\n",
" 4 × 2 grids: 2.6611\n",
" 5 × 2 grids: 2.7899\n",
" 6 × 2 grids: 2.8772\n",
" 7 × 2 grids: 2.9399\n",
" 8 × 2 grids: 2.9784\n",
" 9 × 2 grids: 3.0066\n",
"10 × 2 grids: 3.0256\n",
"11 × 2 grids: 3.0587\n",
"12 × 2 grids: 3.0636\n",
"13 × 2 grids: 3.0728\n",
"14 × 2 grids: 3.0804\n",
"15 × 2 grids: 3.0969\n",
"16 × 2 grids: 3.1046\n",
"17 × 2 grids: 3.1094\n",
"18 × 2 grids: 3.1201\n",
"19 × 2 grids: 3.1187\n",
"20 × 2 grids: 3.1297\n",
"21 × 2 grids: 3.1326\n",
"22 × 2 grids: 3.1296\n",
"23 × 2 grids: 3.1403\n",
"24 × 2 grids: 3.1367\n",
"25 × 2 grids: 3.1383\n"
]
}
],
"source": [
"do(25, 2)"
]
},
{
"cell_type": "markdown",
"id": "90a6dc1c-c570-4bfd-8fe9-210e80c6a455",
"metadata": {},
"source": [
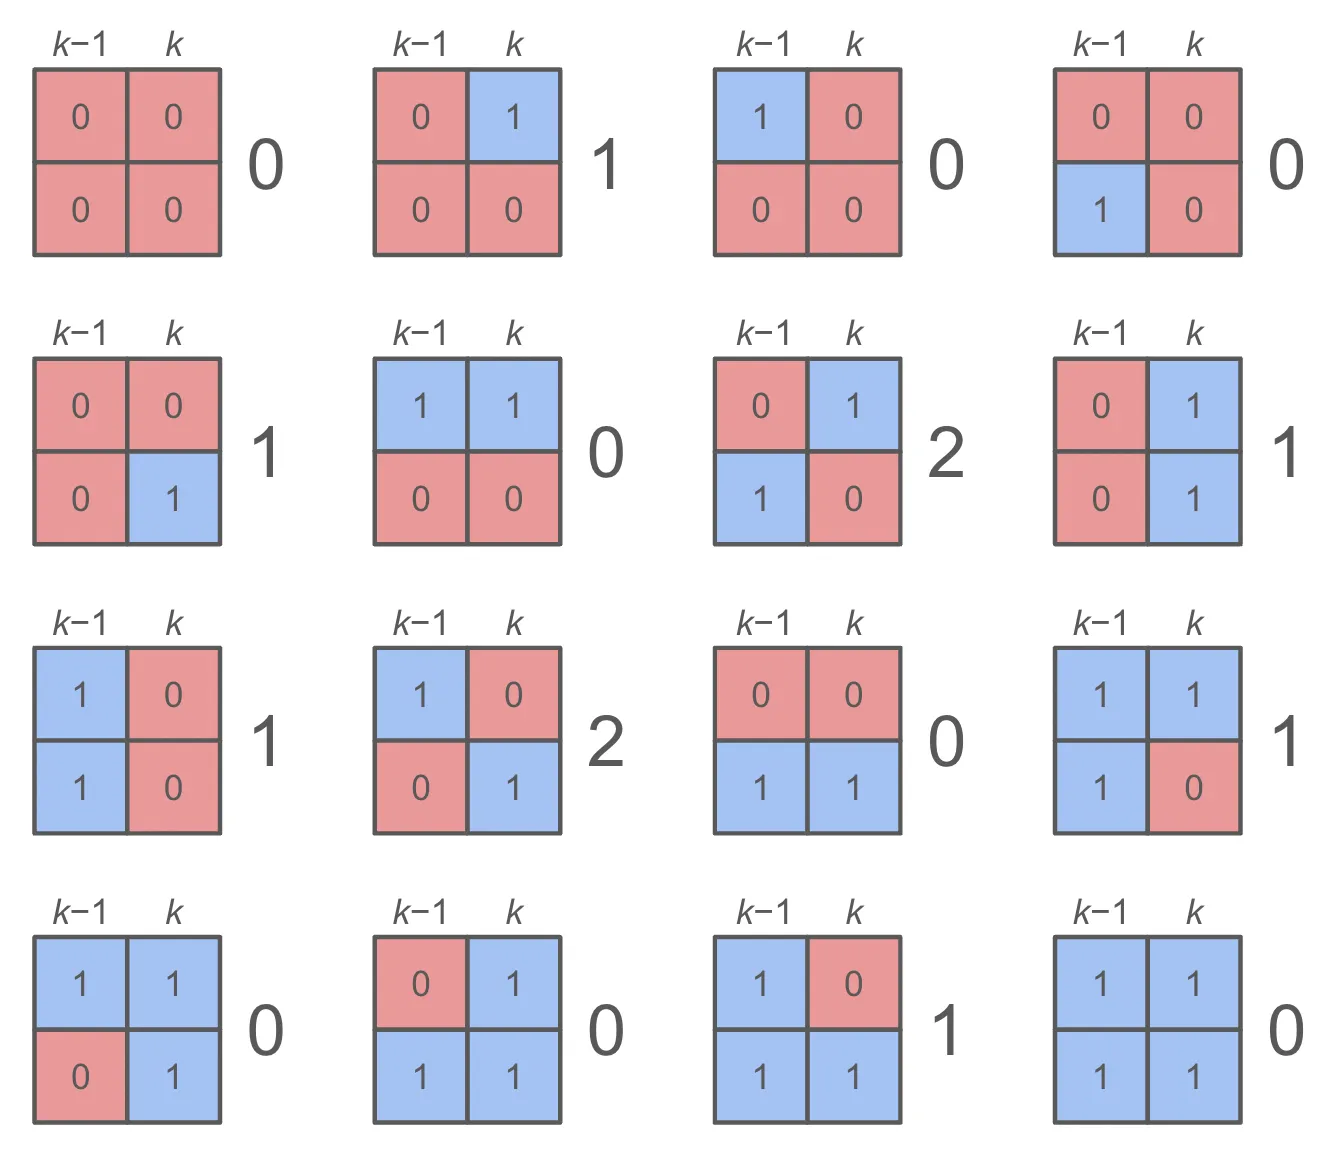
"Now it is clear that the mean is well above 3. At this point I tried to come up with a mathematical analysis but made a mistake. Fortunately, Zach [provides the answer](https://thefiddler.substack.com/p/can-you-eclipse-via-ellipse) by breaking down the possibilities into cases. With the single-row grid, we only needed two cases: column *k* introduced a new cluster 1/2 the time. But with two rows there are 16 cases: each of the two squares in column *k* and the two in column *k* - 1 can be either red or blue. Overall, as aach's diagram below shows, there are 10 new clusters introduced in 16 cases, so the number of new clusters per column is 10/16, and the average cluster size over *W* columns is 2*W* / ((10/16)·*W*) = 16/5 = 3.2.\n",
"\n",
""
]
},
{
"cell_type": "markdown",
"id": "9c0b08ba-7e6b-42ff-884a-5dd010bcfa3a",
"metadata": {},
"source": [
"# Three-Row Grids\n",
"\n",
"Let's next consider grids of size *n* × 3 :"
]
},
{
"cell_type": "code",
"execution_count": 9,
"id": "b29ddec0-5fd2-4f8e-96af-f4b380c6eb59",
"metadata": {},
"outputs": [
{
"name": "stdout",
"output_type": "stream",
"text": [
" Average cluster size over all possible grids of width 1–6 and height 3:\n",
" 1 × 3 grids: 1.7500\n",
" 2 × 3 grids: 2.4688\n",
" 3 × 3 grids: 2.8986\n",
" 4 × 3 grids: 3.1591\n",
" 5 × 3 grids: 3.3266\n",
" 6 × 3 grids: 3.4408\n"
]
}
],
"source": [
"do(6, 3, all)"
]
},
{
"cell_type": "code",
"execution_count": 10,
"id": "7e231093-9e10-446d-8b32-25952b286e1e",
"metadata": {},
"outputs": [
{
"name": "stdout",
"output_type": "stream",
"text": [
" Average cluster size over 30,000 randomly sampled grids of width 1–25 and height 3:\n",
" 1 × 3 grids: 1.7507\n",
" 2 × 3 grids: 2.4668\n",
" 3 × 3 grids: 2.8953\n",
" 4 × 3 grids: 3.1560\n",
" 5 × 3 grids: 3.3236\n",
" 6 × 3 grids: 3.4452\n",
" 7 × 3 grids: 3.5230\n",
" 8 × 3 grids: 3.5881\n",
" 9 × 3 grids: 3.6304\n",
"10 × 3 grids: 3.6695\n",
"11 × 3 grids: 3.6897\n",
"12 × 3 grids: 3.7266\n",
"13 × 3 grids: 3.7455\n",
"14 × 3 grids: 3.7636\n",
"15 × 3 grids: 3.7772\n",
"16 × 3 grids: 3.7995\n",
"17 × 3 grids: 3.8018\n",
"18 × 3 grids: 3.8090\n",
"19 × 3 grids: 3.8220\n",
"20 × 3 grids: 3.8290\n",
"21 × 3 grids: 3.8318\n",
"22 × 3 grids: 3.8514\n",
"23 × 3 grids: 3.8500\n",
"24 × 3 grids: 3.8580\n",
"25 × 3 grids: 3.8639\n"
]
}
],
"source": [
"do(25, 3)"
]
},
{
"cell_type": "markdown",
"id": "bf56480e-4bb5-40f9-b1a9-c380eb698046",
"metadata": {},
"source": [
"The mathematical analysis here is much trickier. With two rows, we can tell how many new clusters are introduced in column *k* just by looking at column *k* - 1. But with three or more rows, that's no longer true. Suppose the top and bottom squares in a column are red. Is that one red cluster or two? We have to look a potentially *unbounded* number of columns away to see if they are connected (by a column that has red in all three squares). So no local analysis can determine the number of new clusters per column; we'll need some new method of analysis. \n",
"\n",
"Interestingly, this is the same limitation that Minsky and Papert noticed in the book [Perceptrons](https://direct.mit.edu/books/monograph/3132/PerceptronsAn-Introduction-to-Computational); their analysis caused many researchers to draw the conclusion that neural networks were no good; they should have instead drawn the conclusion that single-layer neural networks are no good but mult-layer ones avoid the limitations."
]
},
{
"cell_type": "markdown",
"id": "26567fd7-dbf5-44b1-98a6-de8d4f95a20f",
"metadata": {},
"source": [
"# Adding Colors\n",
"\n",
"What if we add a third color? That should make the average cluster size smaller (since there are more chances for neighboring squares to be different colors). I'll start with a single row:"
]
},
{
"cell_type": "code",
"execution_count": 11,
"id": "dc4dc1f5-f5f4-4d69-8bdf-c00d21d978cd",
"metadata": {},
"outputs": [
{
"name": "stdout",
"output_type": "stream",
"text": [
" Average cluster size over all possible grids of width 1–11 and height 1:\n",
" 1 × 1 grids: 1.0000\n",
" 2 × 1 grids: 1.3333\n",
" 3 × 1 grids: 1.4444\n",
" 4 × 1 grids: 1.4815\n",
" 5 × 1 grids: 1.4938\n",
" 6 × 1 grids: 1.4979\n",
" 7 × 1 grids: 1.4993\n",
" 8 × 1 grids: 1.4998\n",
" 9 × 1 grids: 1.4999\n",
"10 × 1 grids: 1.5000\n",
"11 × 1 grids: 1.5000\n"
]
}
],
"source": [
"do(11, 1, all, colors='RGB')"
]
},
{
"cell_type": "markdown",
"id": "7afd16c2-99bd-410b-b5a8-d20862b7b1f5",
"metadata": {},
"source": [
"This is straightforward: the mean cluster size converges to 3/2; the analysis says that this is true because each column starts a new cluster 2/3 of the time, on average.\n",
"\n",
"Now for a two-row grid with three colors. I'll use random sampling:"
]
},
{
"cell_type": "code",
"execution_count": 12,
"id": "37f4a825-d75c-4275-b2c4-6dd3de080b3f",
"metadata": {},
"outputs": [
{
"name": "stdout",
"output_type": "stream",
"text": [
" Average cluster size over 30,000 randomly sampled grids of width 1–25 and height 2:\n",
" 1 × 2 grids: 1.3320\n",
" 2 × 2 grids: 1.6609\n",
" 3 × 2 grids: 1.7763\n",
" 4 × 2 grids: 1.8300\n",
" 5 × 2 grids: 1.8569\n",
" 6 × 2 grids: 1.8685\n",
" 7 × 2 grids: 1.8816\n",
" 8 × 2 grids: 1.8874\n",
" 9 × 2 grids: 1.8936\n",
"10 × 2 grids: 1.9009\n",
"11 × 2 grids: 1.9026\n",
"12 × 2 grids: 1.9045\n",
"13 × 2 grids: 1.9031\n",
"14 × 2 grids: 1.9056\n",
"15 × 2 grids: 1.9151\n",
"16 × 2 grids: 1.9119\n",
"17 × 2 grids: 1.9110\n",
"18 × 2 grids: 1.9121\n",
"19 × 2 grids: 1.9106\n",
"20 × 2 grids: 1.9144\n",
"21 × 2 grids: 1.9152\n",
"22 × 2 grids: 1.9139\n",
"23 × 2 grids: 1.9156\n",
"24 × 2 grids: 1.9165\n",
"25 × 2 grids: 1.9156\n"
]
}
],
"source": [
"do(25, 2, colors='RGB')"
]
},
{
"cell_type": "markdown",
"id": "3c18f723-447f-4cd6-ba27-59db37e87659",
"metadata": {},
"source": [
"This seems to converge to about 1.92. To analye this for the two-color case we had to look at 24 = 16 cases; with three colors we have 34 = 81 cases; I haven't gone through them all to do the calculation. (But you can.)"
]
},
{
"cell_type": "markdown",
"id": "6a36b07b-8e5c-4048-8046-7619b34f6b26",
"metadata": {},
"source": [
"# Larger Grids\n",
"\n",
"What about a grid that is unbounded in all directions? I can't fit that into a finite computer, but I can easily examine random grids of size 100 × 100 or more:"
]
},
{
"cell_type": "code",
"execution_count": 13,
"id": "6abd1ae5-852f-459c-ad6e-1e91d91566b0",
"metadata": {},
"outputs": [
{
"data": {
"text/plain": [
"7.2028626172827535"
]
},
"execution_count": 13,
"metadata": {},
"output_type": "execute_result"
}
],
"source": [
"mean_cluster_size(random_grids(100, 100, N=200))"
]
},
{
"cell_type": "code",
"execution_count": 14,
"id": "ac814364-c03d-4888-bbbf-b0d6ac6c6625",
"metadata": {},
"outputs": [
{
"data": {
"text/plain": [
"7.400513340948056"
]
},
"execution_count": 14,
"metadata": {},
"output_type": "execute_result"
}
],
"source": [
"mean_cluster_size(random_grids(200, 200, N=200))"
]
},
{
"cell_type": "code",
"execution_count": 15,
"id": "8824b41d-6224-4156-94a8-6d0ab3e6a1a6",
"metadata": {},
"outputs": [
{
"data": {
"text/plain": [
"7.468919989722078"
]
},
"execution_count": 15,
"metadata": {},
"output_type": "execute_result"
}
],
"source": [
"mean_cluster_size(random_grids(300, 300, N=200))"
]
},
{
"cell_type": "markdown",
"id": "6d20f32a-8c7a-4456-aa41-d2989e33fd57",
"metadata": {},
"source": [
"I think that what's happening is that the clusters that are near the edge of the grid get arbitrarily cut off, and since the edge is a smaller percentage of larger grids, a larger grid has a larger mean cluster size, one that is a better representative of what would happen on an infinite grid. But I can't say exactly what the mean converges to; probably somewhere around 7.5."
]
},
{
"cell_type": "markdown",
"id": "f3f21c52-8baf-4e71-a33c-e6f4cefd0877",
"metadata": {},
"source": [
"# Examining Random Clusters\n",
"\n",
"On an *n* × 1 grid a cluster is a straight line. But what do clusters look like on an arbitrarily large grid? I'll define `show` to print a grid (and return the number of colored squares in the grid), and `cluster_at(grid, square)` to return just the part of `grid` that contains `square` and all the other members of square's cluster."
]
},
{
"cell_type": "code",
"execution_count": 16,
"id": "ee6683dd-7b4c-4e4c-b28e-1e8075cc07aa",
"metadata": {},
"outputs": [],
"source": [
"def show(grid: Grid) -> int:\n",
" \"\"\"Print a representation of the grid and return counts for the colors.\"\"\"\n",
" xs = sorted({x for (x, y) in grid})\n",
" ys = sorted({y for (x, y) in grid})\n",
" for y in ys:\n",
" print(*[grid.get((x, y), ' ') for x in xs])\n",
" return len(grid)\n",
"\n",
"def cluster_at(grid: Grid[Square, int], square: Square, color='#') -> Grid[Square, Color]:\n",
" \"\"\"The cluster that square belongs to in grid. Grid must already be clustered.\"\"\"\n",
" cluster_number = grid[square]\n",
" assert isinstance(cluster_number, int), \"grid must be already clustered by cluster(grid)\"\n",
" return {sq: color for sq in grid if grid[sq] == cluster_number}"
]
},
{
"cell_type": "markdown",
"id": "b866bc53-a9b0-45ca-8f85-d796b42fe987",
"metadata": {},
"source": [
"I'll make a 300 x 300 grid and then show the cluster at four different squares, chosen more-or-less randomly:"
]
},
{
"cell_type": "code",
"execution_count": 17,
"id": "35daf49d-9ac8-4cea-b85e-1f95cea2d9d3",
"metadata": {},
"outputs": [],
"source": [
"random.seed(1234)\n",
"\n",
"grid300 = cluster(random_grid(300, 300))"
]
},
{
"cell_type": "code",
"execution_count": 18,
"id": "f23766c7-18b2-4c94-85bf-0346c70eaa21",
"metadata": {},
"outputs": [
{
"name": "stdout",
"output_type": "stream",
"text": [
" # # # # # \n",
" # # # # # # # \n",
" # # # # # # # # \n",
" # # # # # # \n",
" # # # # # # # # # # \n",
" # # # # # # # # # \n",
" # # # # # # # # # # # # \n",
" # # # # # # # # # # # #\n",
" # # # # # # # # # #\n",
" # # # # # # # # # # # # \n",
" # # # # # # # # # # # # # # # # # # \n",
" # # # # # # # # # # # # # # # # # # \n",
" # # # # # # # # # # # # # # # # # # # # \n",
" # # # # # # # # # # \n",
" # # # # # # # # # # # # \n",
"# # # # # # # # # # # # \n",
" # # # # # # # \n",
"# # # # # # # # # \n",
"# # # # # \n",
" # # # # # # # # # # # \n",
" # # # # # # # \n",
" # # # # # # \n",
" # # # # # # # # # \n",
" # # # # \n",
" # \n"
]
},
{
"data": {
"text/plain": [
"240"
]
},
"execution_count": 18,
"metadata": {},
"output_type": "execute_result"
}
],
"source": [
"show(cluster_at(grid300, (150, 150)))"
]
},
{
"cell_type": "code",
"execution_count": 19,
"id": "408ad7a8-9cd6-4d0a-a7e1-170581eb4c45",
"metadata": {},
"outputs": [
{
"name": "stdout",
"output_type": "stream",
"text": [
" # # \n",
" # # # # \n",
" # \n",
" # \n",
" # # \n",
" # # \n",
" # \n",
" # # # # # # # # # # \n",
" # # # # # # # # # \n",
" # # # # # # # \n",
" # # # # # # # # \n",
" # # # # # # # # # # # # \n",
" # # # # # # # \n",
" # # # # # # # # # \n",
" # # # # # # # # # # \n",
" # # # # # # # # # # # # #\n",
" # # # # # # # # # # # # \n",
" # # # # # # # # # # # # # # # # \n",
"# # # # # # # # # # # \n",
"# # # # # # # # \n",
" # # # # # \n",
" # # # # # # # # \n",
" # # \n",
"# # # \n",
" # \n"
]
},
{
"data": {
"text/plain": [
"164"
]
},
"execution_count": 19,
"metadata": {},
"output_type": "execute_result"
}
],
"source": [
"show(cluster_at(grid300, (150, 200)))"
]
},
{
"cell_type": "code",
"execution_count": 20,
"id": "1827747e-76ac-496e-ad3b-b7cbf8b5201a",
"metadata": {},
"outputs": [
{
"name": "stdout",
"output_type": "stream",
"text": [
" # # # \n",
" # # # # # # \n",
" # # # # \n",
" # # # # # \n",
" # # # # # # # \n",
" # # # # # # # #\n",
" # # # # # # # # # \n",
" # # # # # # # # # # \n",
" # # # # # \n",
" # # \n",
" # # \n",
" # # # # # # \n",
" # # # # # \n",
" # # # # # # # # \n",
" # # # # # # # \n",
" # # # \n",
" # # # # \n",
" # # # # # # \n",
" # # # # # # # \n",
" # # # # # # # \n",
" # # # # # # # \n",
" # # # # # # # # # # \n",
" # # # # # # # # # # # # \n",
" # # # # # # \n",
" # # # # # # # \n",
" # # # # # # # # \n",
" # # # # # # # # # \n",
" # # # # # # # # \n",
" # # # # # # # \n",
" # # # # # # # # # # # \n",
" # # # # # # # # # # # # # # \n",
" # # # # # # # # # # # # # \n",
"# # # # # # # # # # # # \n",
" # # # # # \n",
" # # # # # \n",
" # # # # # # # # \n",
" # # # \n",
" # # # # # # # \n",
" # # # # # \n",
" # # # # # \n",
"# # # # # # # # # \n",
" # # # # # # # \n",
" # \n"
]
},
{
"data": {
"text/plain": [
"293"
]
},
"execution_count": 20,
"metadata": {},
"output_type": "execute_result"
}
],
"source": [
"show(cluster_at(grid300, (200, 150)))"
]
},
{
"cell_type": "code",
"execution_count": 21,
"id": "fd429e22-b8bd-475e-9bb0-cbdac2d57c0e",
"metadata": {},
"outputs": [
{
"name": "stdout",
"output_type": "stream",
"text": [
"#\n"
]
},
{
"data": {
"text/plain": [
"1"
]
},
"execution_count": 21,
"metadata": {},
"output_type": "execute_result"
}
],
"source": [
"show(cluster_at(grid300, (200, 200)))"
]
},
{
"cell_type": "markdown",
"id": "faf079b0-8534-4d92-aa8e-acd035dc5420",
"metadata": {},
"source": [
"We see that there is a lot of variation in size and shape of the clusters. To get a better idea of the variation I introduce `cluster_counts(S)` to do the following: make an S x S grid; cluster it; define `sizes` such that `sizes[cluster_number]` gives the cluster's size; define the set of squares in the `perimeter`; define the set of clusters that touch the perimeter (and thus have a size that might be smaller than it should be); and finally return a Counter that for each cluster size gives the number of squares that are in a cluster of that size:"
]
},
{
"cell_type": "code",
"execution_count": 22,
"id": "77c0aba0-700d-486e-ba9e-d70dbe11097e",
"metadata": {},
"outputs": [],
"source": [
"def cluster_counts(S: int) -> Counter:\n",
" \"\"\"For a random SxS grid, return a counter of {cluster_size: squares_with_that_size},\n",
" for all squares that are not part of a cluster that touches the perimeter.\"\"\"\n",
" grid = cluster(random_grid(S, S)) # Grid of {square: cluster_number}\n",
" sizes = Counter(grid.values()) # Counter of {cluster_number: cluster_size}\n",
" perimeter = cross([0, S - 1], range(S)) | cross(range(S), [0, S - 1]) # Squares on perimeter\n",
" perimeter_clusters = {grid[p] for p in perimeter} # Cluster numbers on perimeter squares\n",
" return Counter(sizes[grid[sq]] for sq in grid if grid[sq] not in perimeter_clusters)\n",
"\n",
"def cross(xs, ys) -> Set[Square]: return {(x, y) for x in xs for y in ys}"
]
},
{
"cell_type": "markdown",
"id": "a314bce0-fe3c-490c-a859-3650266542c2",
"metadata": {},
"source": [
"I'll then define `counter_stats` to return a dict of statistics about a counter, and use it to explore our cluster counts:"
]
},
{
"cell_type": "code",
"execution_count": 23,
"id": "44f89808-d7a6-47ec-8945-d6f6c4affbb9",
"metadata": {},
"outputs": [
{
"data": {
"text/plain": [
"{'mean': 58.88548665248869,\n",
" 'N': 974751,\n",
" 'range': range(1, 734),\n",
" 'common': [(1, 62777),\n",
" (2, 31428),\n",
" (3, 28983),\n",
" (4, 25780),\n",
" (5, 23480),\n",
" (6, 21900),\n",
" (7, 20412),\n",
" (8, 18168),\n",
" (9, 17316),\n",
" (10, 16280)]}"
]
},
"execution_count": 23,
"metadata": {},
"output_type": "execute_result"
}
],
"source": [
"def counter_stats(counter: Counter, common=10) -> dict:\n",
" \"\"\"Return a dict of some statistics for the values in this counter.\"\"\"\n",
" return dict(mean=mean(counter.elements()), N=sum(counter.values()), \n",
" range=range(min(counter), max(counter) + 1), common=counter.most_common(common))\n",
"\n",
"counter_stats(cluster_counts(1000))"
]
},
{
"cell_type": "markdown",
"id": "b0005025-4a9e-4fe9-ac04-0d1ce43812f8",
"metadata": {},
"source": [
"Wait a minute ... earler we saw that the average cluster size on a 300 x 300 grid was about 7.5. But the `counter_stats` here give a `mean` cluster size of somewhere around 60. How can that be? It is because the two numbers are answering two different questions. **7.5** is the answer to \"if we randomly pick a **cluster**, what is its expected size\"? **60** is the answer to \"if we randomly pick a **square**, what is the expected size of the square's cluster?\"\n",
"\n",
"In the output from `counter_stats`, the `common` entry gives a list of the ten most common sizes (which happen to be the integers from 1 to 10), paired with the counts of how many squares have that size cluster. On average, 1/16 of the clusters have size 1, (when all 4 neighbors of the start square get the opposite color). Half as many have size 2. A cluster with hundreds of squares is far less common, but certainly possible.\n",
"\n"
]
},
{
"cell_type": "markdown",
"id": "0758d4b5-76fa-47e6-85c1-478a772e400e",
"metadata": {},
"source": [
"# Tests\n",
"\n",
"Some unit tests to give confidence in the code, and show examples of use:"
]
},
{
"cell_type": "code",
"execution_count": 24,
"id": "da7a19ef-d47f-4c69-8fe5-cfaf79861dab",
"metadata": {},
"outputs": [],
"source": [
"assert all_grids(1, 3) == [\n",
" {(0, 0): 'R', (0, 1): 'R', (0, 2): 'R'},\n",
" {(0, 0): 'R', (0, 1): 'R', (0, 2): 'B'},\n",
" {(0, 0): 'R', (0, 1): 'B', (0, 2): 'R'},\n",
" {(0, 0): 'R', (0, 1): 'B', (0, 2): 'B'},\n",
" {(0, 0): 'B', (0, 1): 'R', (0, 2): 'R'},\n",
" {(0, 0): 'B', (0, 1): 'R', (0, 2): 'B'},\n",
" {(0, 0): 'B', (0, 1): 'B', (0, 2): 'R'},\n",
" {(0, 0): 'B', (0, 1): 'B', (0, 2): 'B'}]\n",
"\n",
"assert all_grids(1, 2, 'RGB') == [\n",
" {(0, 0): 'R', (0, 1): 'R'},\n",
" {(0, 0): 'R', (0, 1): 'G'},\n",
" {(0, 0): 'R', (0, 1): 'B'},\n",
" {(0, 0): 'G', (0, 1): 'R'},\n",
" {(0, 0): 'G', (0, 1): 'G'},\n",
" {(0, 0): 'G', (0, 1): 'B'},\n",
" {(0, 0): 'B', (0, 1): 'R'},\n",
" {(0, 0): 'B', (0, 1): 'G'},\n",
" {(0, 0): 'B', (0, 1): 'B'}]\n",
"\n",
"grid6x1 = one_grid(6, 1, 'RRBBBR')\n",
"assert grid6x1 == {(0, 0): 'R', (1, 0): 'R', (2, 0): 'B', (3, 0): 'B', (4, 0): 'B', (5, 0): 'R'}\n",
"assert cluster(grid6x1) == {(0, 0): 1, (1, 0): 1, (2, 0): 2, (3, 0): 2, (4, 0): 2, (5, 0): 3}\n",
"assert mean_cluster_size([grid6x1]) == 2\n",
"\n",
"grid5x3 = one_grid(5, 3, 'RR:RR'\n",
" '.R:R.'\n",
" '.RRR.')\n",
"assert cluster(grid5x3) == {\n",
" (0, 0): 1, (1, 0): 1, (2, 0): 2, (3, 0): 1, (4, 0): 1,\n",
" (0, 1): 3, (1, 1): 1, (2, 1): 2, (3, 1): 1, (4, 1): 4,\n",
" (0, 2): 3, (1, 2): 1, (2, 2): 1, (3, 2): 1, (4, 2): 4}\n",
"assert mean_cluster_size([grid5x3]) == 3.75\n",
"\n",
"grid10x2 = one_grid(10, 2, 'RBRBRRRBBR' # Example from diagram at top of notebook\n",
" 'RRRRBBRBRB') \n",
"assert mean_cluster_size([grid10x2]) == 20/9\n",
"\n",
"grid4x3 = random_grid(3, 4)\n",
"assert len(grid4x3) == 12\n",
"\n",
"assert cross((10, 20, 30), (1, 2, 3)) == {(10, 1), (10, 2), (10, 3), (20, 1), (20, 2), (20, 3), (30, 1), (30, 2), (30, 3)}"
]
}
],
"metadata": {
"kernelspec": {
"display_name": "Python 3 (ipykernel)",
"language": "python",
"name": "python3"
},
"language_info": {
"codemirror_mode": {
"name": "ipython",
"version": 3
},
"file_extension": ".py",
"mimetype": "text/x-python",
"name": "python",
"nbconvert_exporter": "python",
"pygments_lexer": "ipython3",
"version": "3.8.15"
}
},
"nbformat": 4,
"nbformat_minor": 5
}